Troubleshooting
Warning
work in progress…
Note
If you are missing something in this documentation, please say hello in our slack #doc channel and let us know what is missing or should be good to have.
- join OwlH slack - OwlH Slack workspace
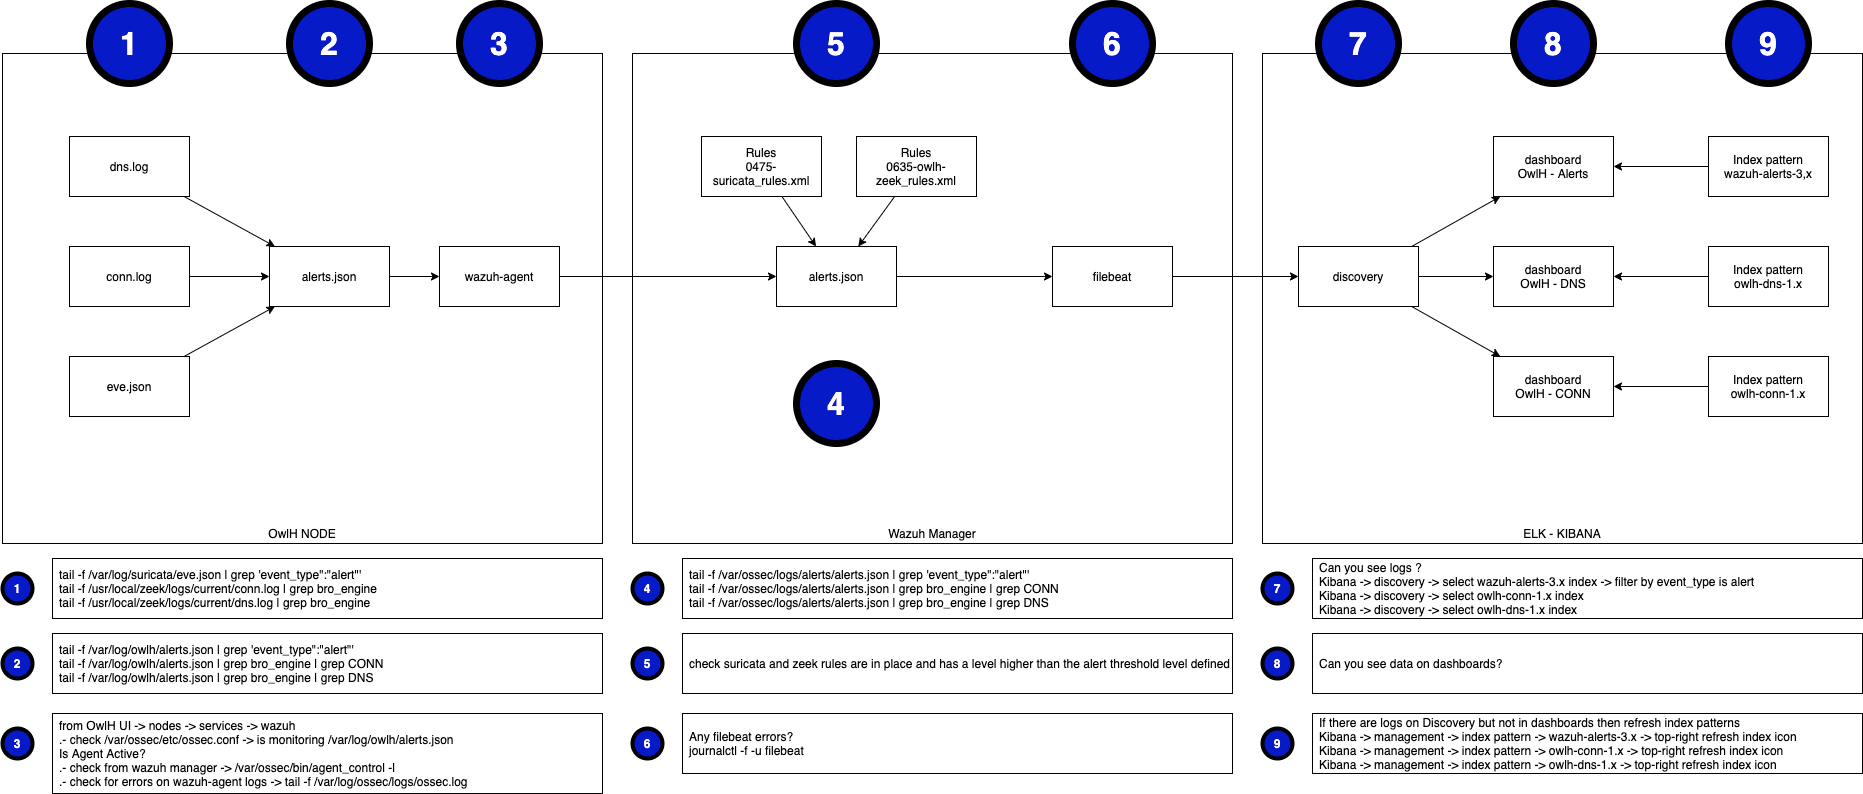
Check Flow Data diagram and checkpoints.
OwlH Node
OwlH Master
OwlH UI
OwlH Dashboards on Kibana
Can’t see any alert on owlh-alert dashboard
Maybe Saved Queries are using a different index pattern than the one you are using:
- Open Saved queries OwlH Alert, OwlH Conn and OwlH DNS.
- OwlH Alert should be using wazuh-alerts-3.x, wazuh-alerts-4.x or wazuh-alerts-* depending on your Wazuh version. if you are running wazuh 3.x use wazuh-alerts-3.x. if running wazuh 4.x choose wazuh-alerts-*.
- Save, you should see now events in discovery, if any then your dashboard should work now.
If your OwlH Alerts dashboard isn’t showing anything maybe is because your wazuh-alerts index pattern needs to be updated.
- detect if you need to refresh index patter by searching on discovery for event_type. open any event found and look for alert symbol. If you can see alert symbol then you need to refresh your index pattern
- go kibana -> management -> index pattern -> wazuh-alerts pattern -> reload wazuh index pattern
- go back to discovery, verify alert symbol is gone.
- open OwlH Alerts dashboard, you should see alerts now